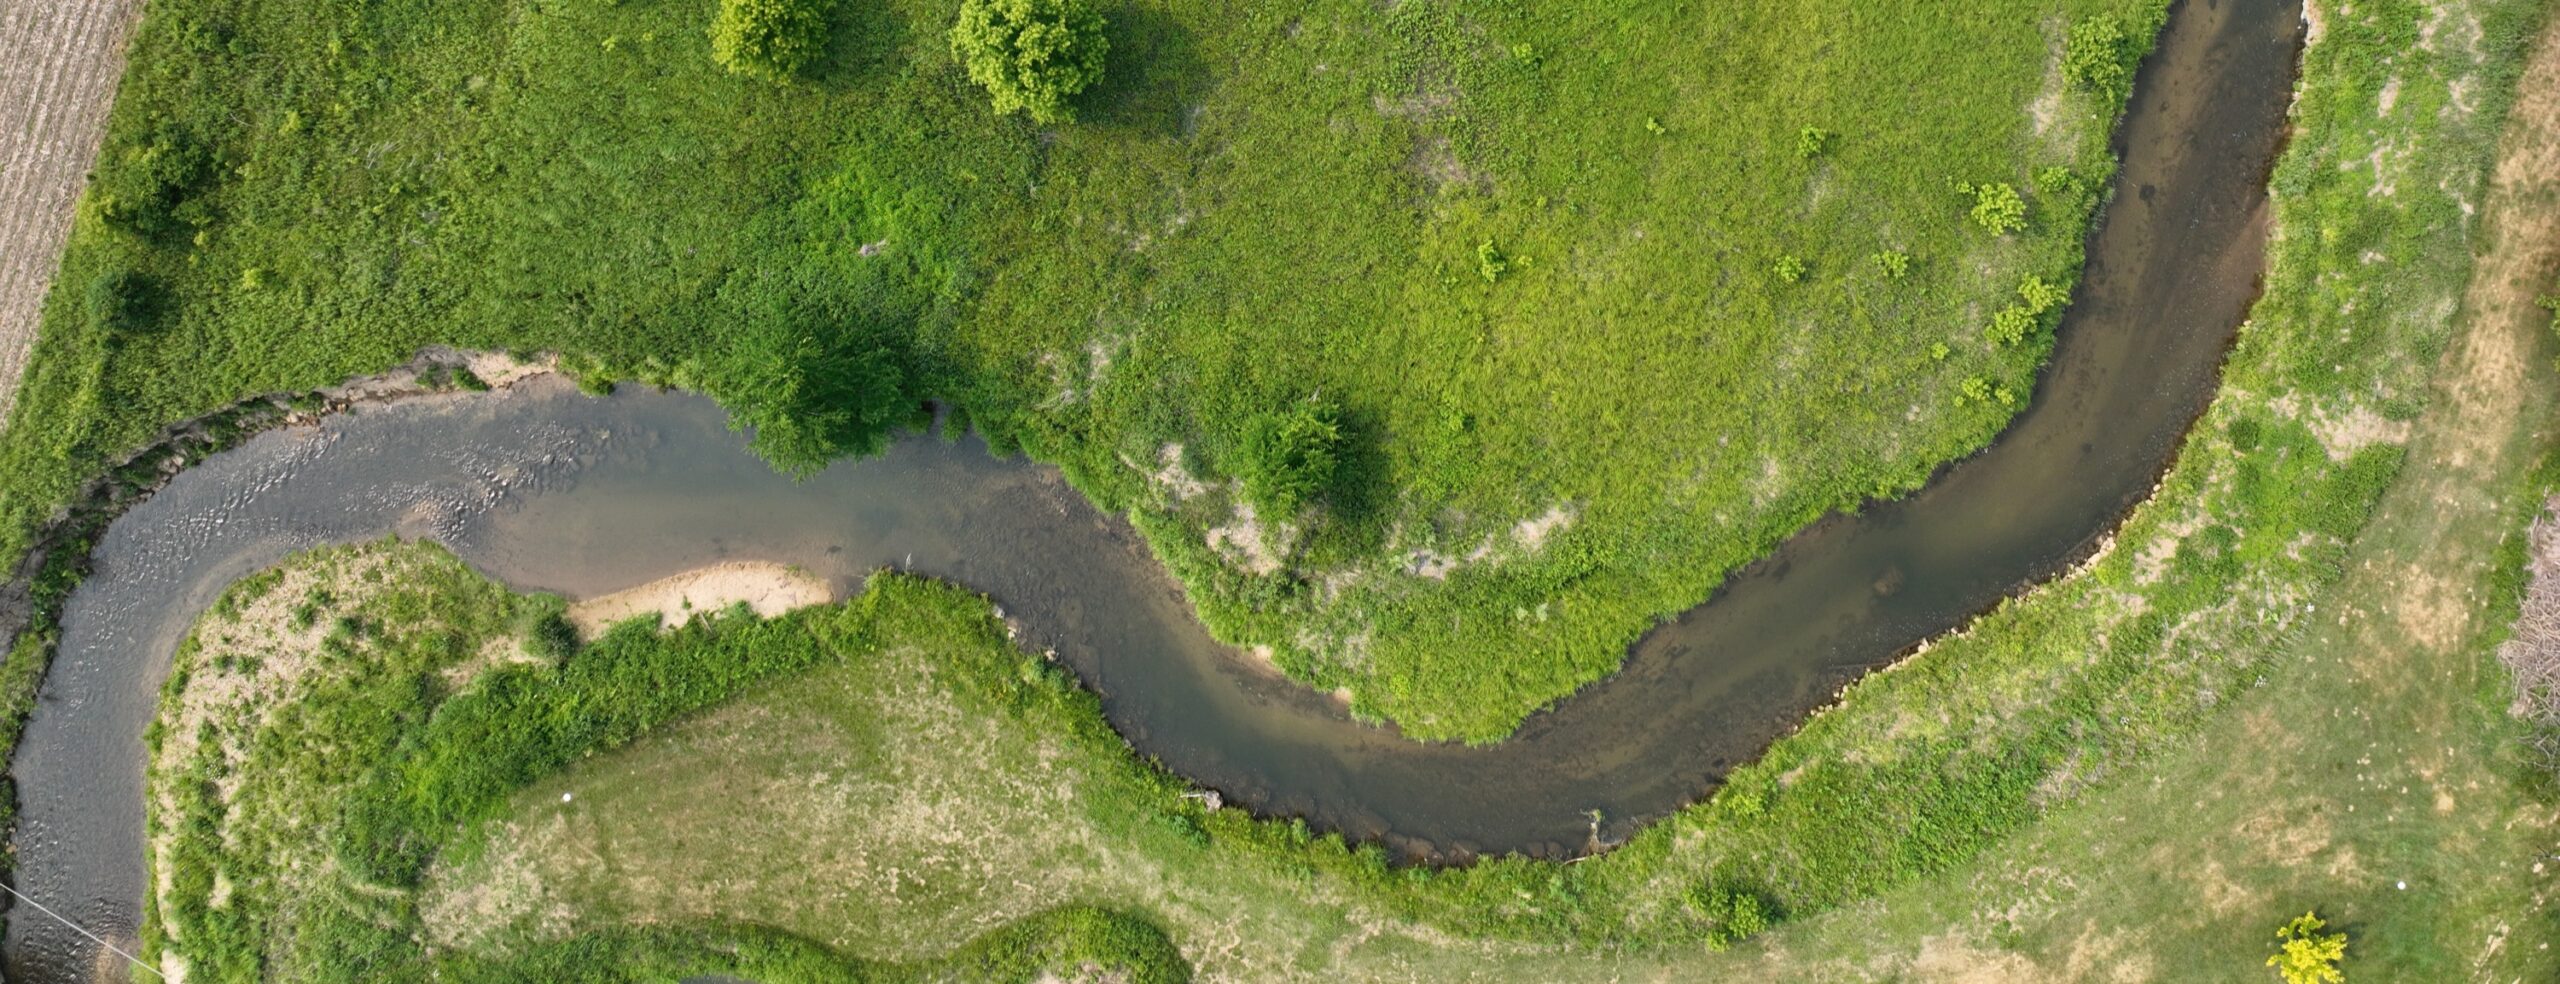
Aerial Data Collection
and Analysis
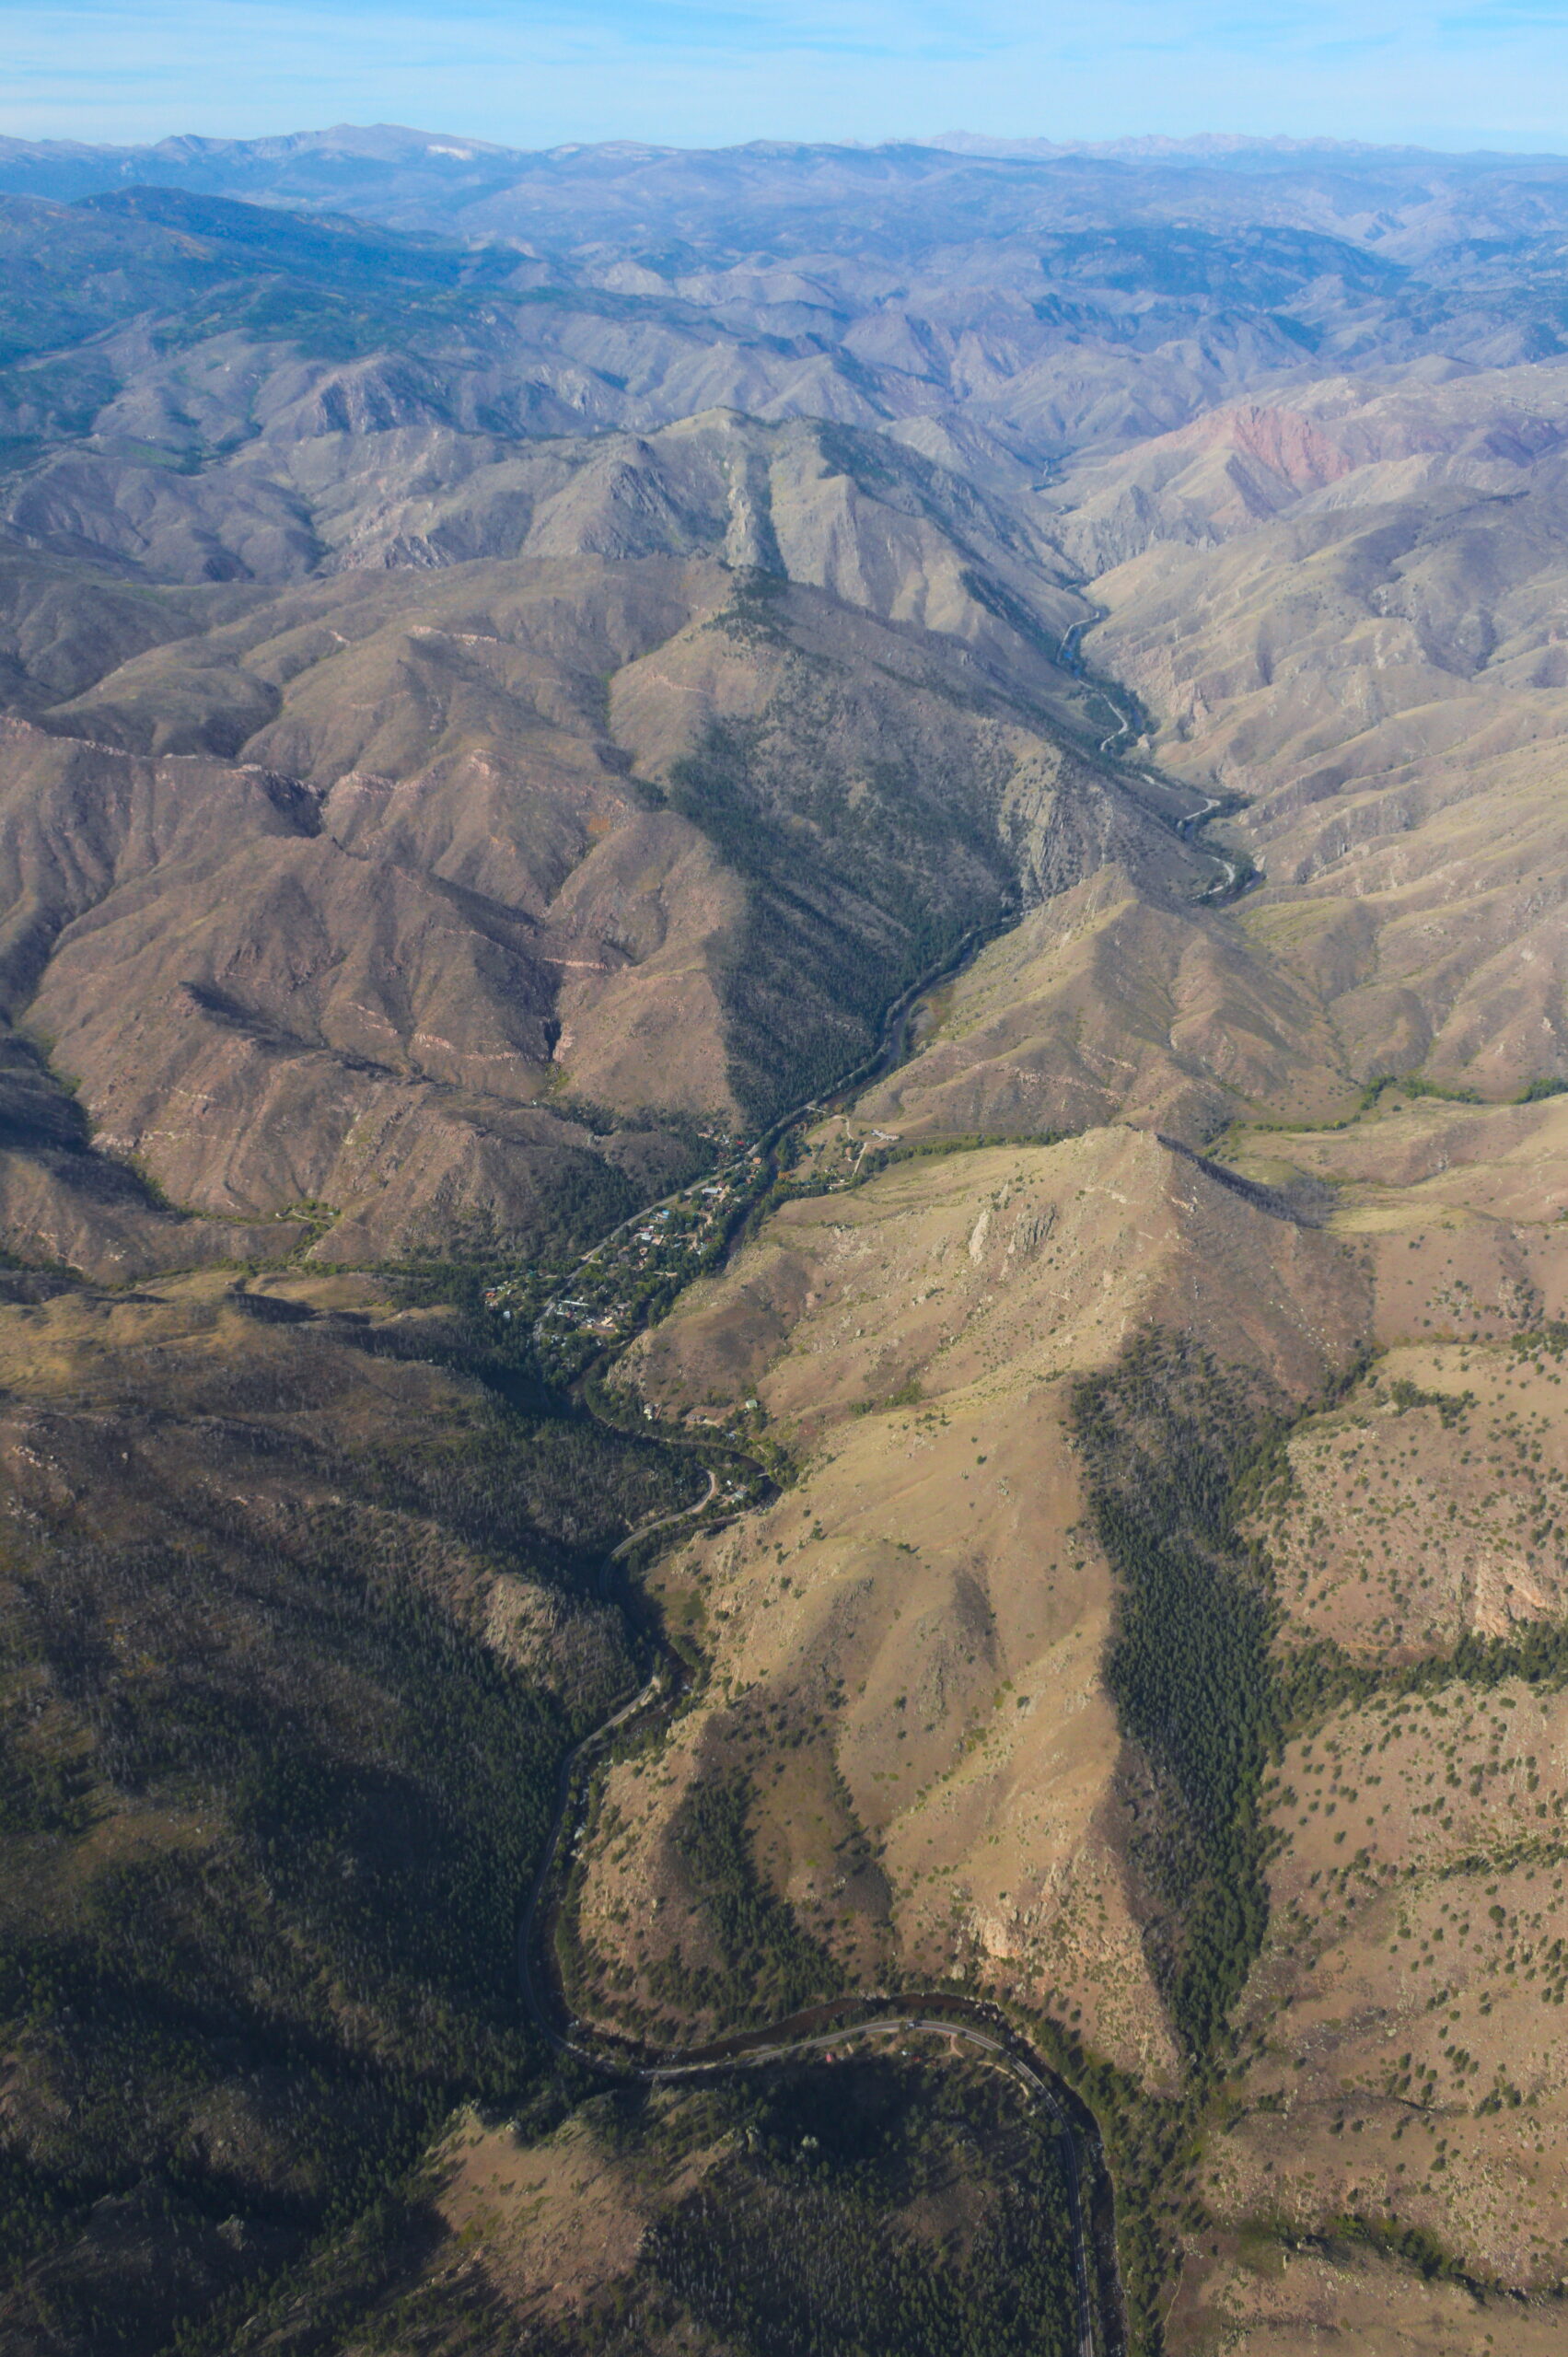
Our Mission
Supporting Practitioners with Aerial Insights
We strive to enhance client productivity and capacity through innovative mapping and analysis, using the right tools for your job.
About Us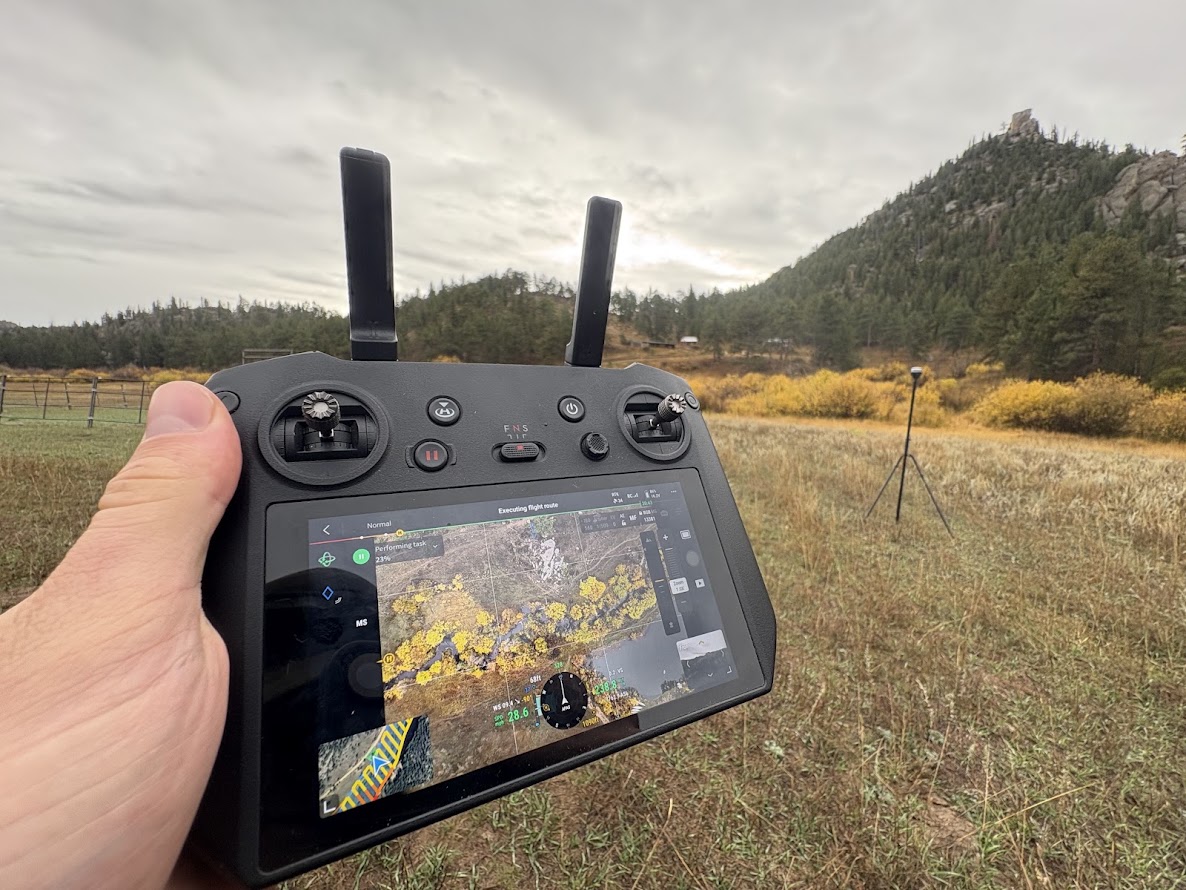
Services
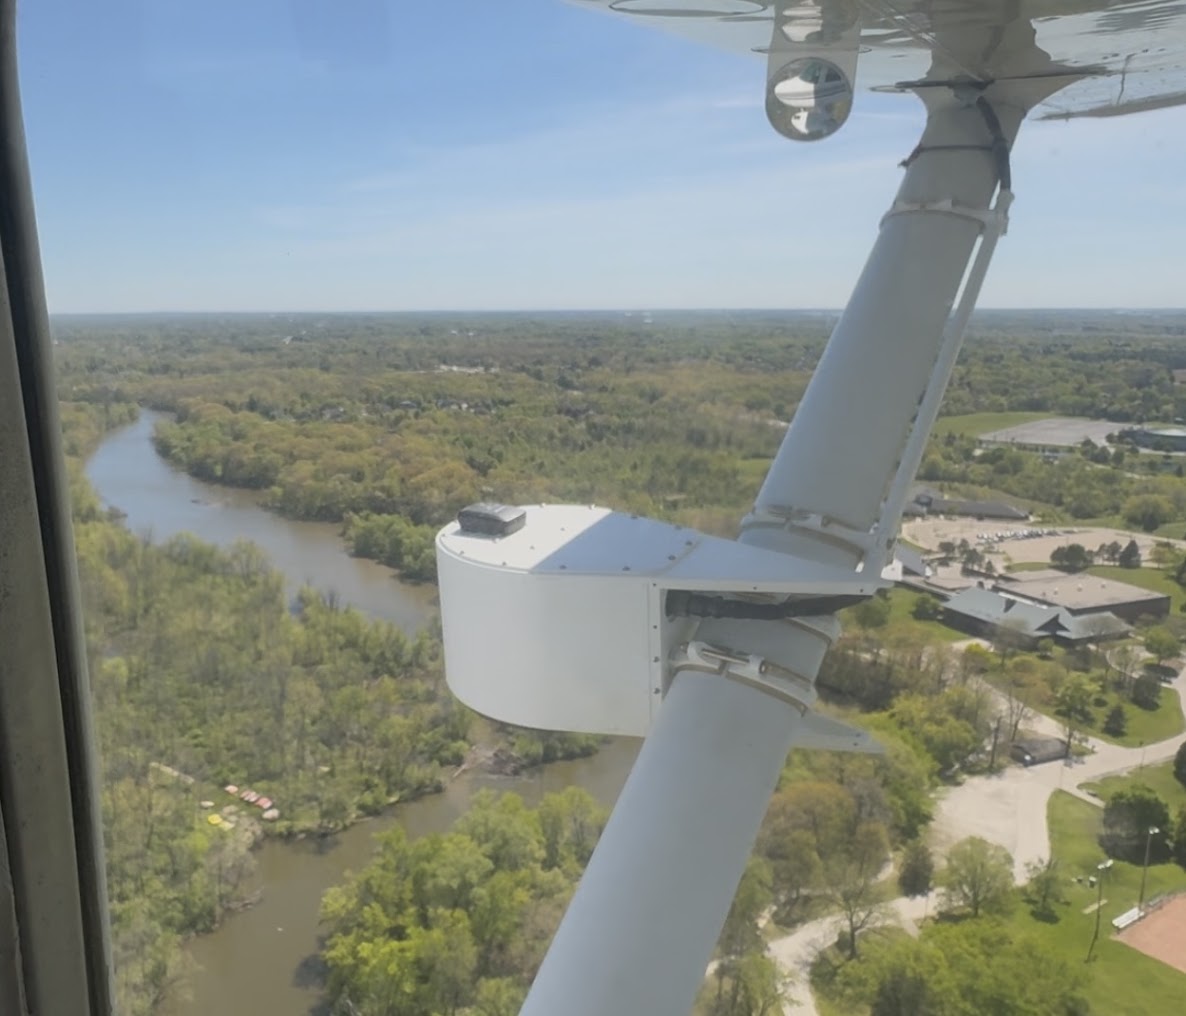
High Resolution Imagery
from Drones and Small Aircraft
Zoom in and explore sample imagery below
Drone
Airplane
We work closely with our clients to collect the information that fits a project’s needs.
- High Resolution Imagery
- Repeat Time Series
- Elevation Maps
- Large Area Mapping
- Rapid Response
- Professional Marketing Images
GIS Analysis
Our maps can be utilized in the GIS software of your choosing to transform pixels into meaningful insights.
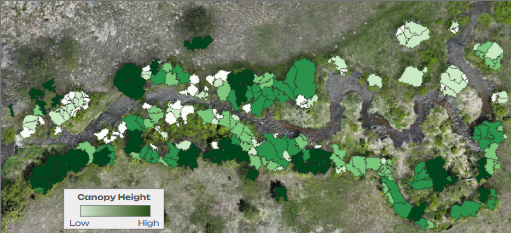
Canopy Height Classification
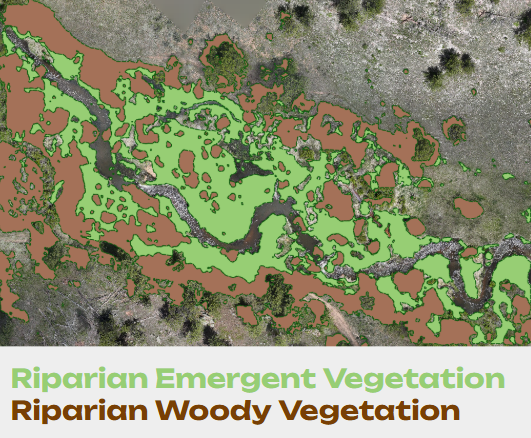
Vegetation Type Classification
- Digitizing
- Machine learning
- Open-Source GIS Workflows
- Cartography
- Statistical Analysis
- Web Maps
Riparian Monitoring Case Study ▼
The following stream site is regularly mapped in order to quantify and document changing channel and vegetation characteristics over time. The imagery and metrics below compare conditions from June 2025 to October 2025.
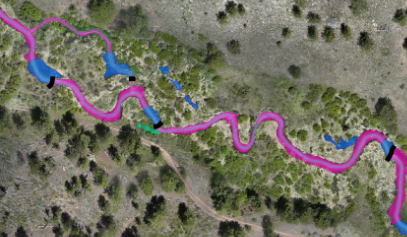
June 2025

October 2025
Inundation
Free-flowing vs. ponded channel area
June 2025
October 2025
Dam Status
Beaver dam condition, June vs. October 2025
June 2025
2
Intact
2
Breached
1
Blown Out
October 2025
6
Intact
0
Breached
0
Blown Out
Channel Length
Primary vs. secondary channel length
June 2025
October 2025
Channel Complexity
Shoreline development index
8.4
June 2025
→
9.3
October 2025
Higher index = more shoreline complexity per unit area
Contact us
Have questions or ready start a project? Reach out to us today to discuss your ideas, schedule a conversation, or simply say hello.